ObjectiveTo understand how bacterial growth rate can be measured and culture bacteria with due regard to safe practice. Safety Hazards and PrecautionsThe organism in use is a potential bio hazard therefore aseptic technique must be used which includes:
Apparatus
Variables
Method
Results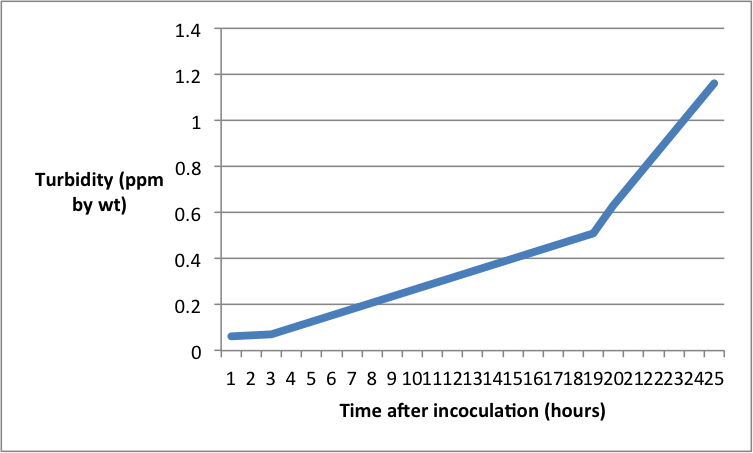 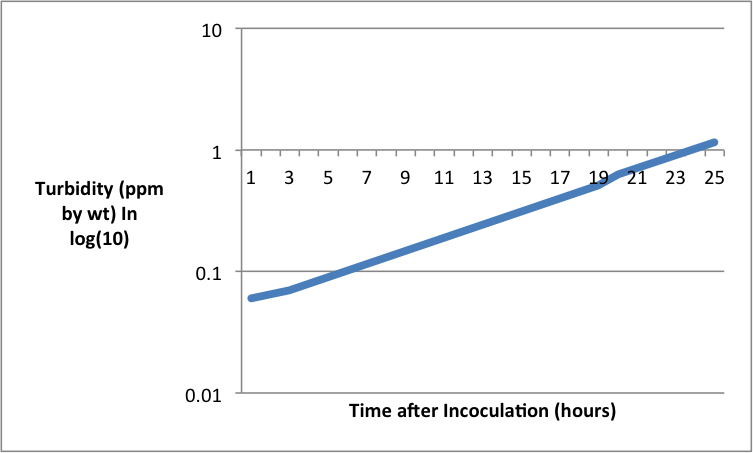 AnalysisFor the purpose of the experiment the turbidity or optical density is representative of colony growth, such as the colony as it grows will let less light through and thus the turbidity goes up. The graph shows an interesting rate of growth within the test sample. We can see a lag phase towards the beginning where there is hardly any growth in the first three hours after inoculation. This is possibly while the bacteria are adjusting to their new environment. There is then a slight increase in rate towards the middle of the log phase where the population increases from 0.07 to 0.54 between hours 3 and 19. At this point the log phase initiates where the gradient and thus the rate of growth increase greatly and the population size increases from 0.54 to 1.16 between hours 19 and 24. This shows an exponential increase in growth phase and curve. These phases are caused by the fact that initially the bacteria are adjusting to their new surroundings and beginning to multiply slowly thus not clouding the medium very much and thus revealing a slow turbidity. Then a significant growth rate increase is hit in the log phase, whereupon the bacteria will begin to use up much of the nutrient available to reproduce which will cloud the mixture giving a higher turbidity. The reason for this is as follows; the variation, with growth rate, of the yield of organism from the substrate used as energy source is attributed to consumption of energy at a constant rate for cell maintenance. From the laws of growth, a simple relation between the maintenance requirement, the growth yield and the growth rate is derived.[1] The exponential growth rate constant is 0.1780, which means the bacteria will take 5 hours to double the population from the beginning. As also shown by the graph. [1] Pirt, S.J., 1965. The maintenance energy of bacteria in growing cultures. Proceedings of the Royal Society of London B: Biological Sciences, 163(991), pp.224-231. EvaluationThe experiment was performed well on a whole however there are tow noteworthy comment to be made. First of all a value was eliminated from the graph due to its anomalous nature as it came into a negative value at the beginning, this could also not be placed on a log scale thus was removed from the experiment. Possibly repeating the experiment in order to gain a broader range of results would help to produce a set of data with no anomalous results. Further to that it would allow an average exponential growth rate for this particular bacteria in these conditions. Secondly the experiment could have been done for longer. The end of the graph shows the beginning of the log phase and doesn’t reach a plateau or death phase. Perhaps increasing the time the experiment is done over to 48 hours would reveal the further phases of the microbial growth. Evidence
1 Comment
Anon
2/6/2020 07:49:16 am
Thank you so much. This helped me for my practical Leave a Reply. |
 RSS Feed
