ObjectiveTo understand how bacterial growth rate can be measured and culture bacteria with due regard to safe practice. Safety Hazards and PrecautionsThe organism in use is a potential bio hazard therefore aseptic technique must be used which includes:
Apparatus
Variables
Method
Results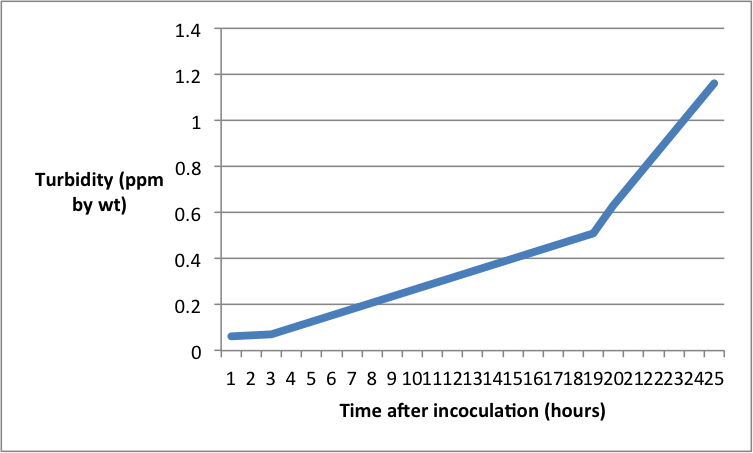 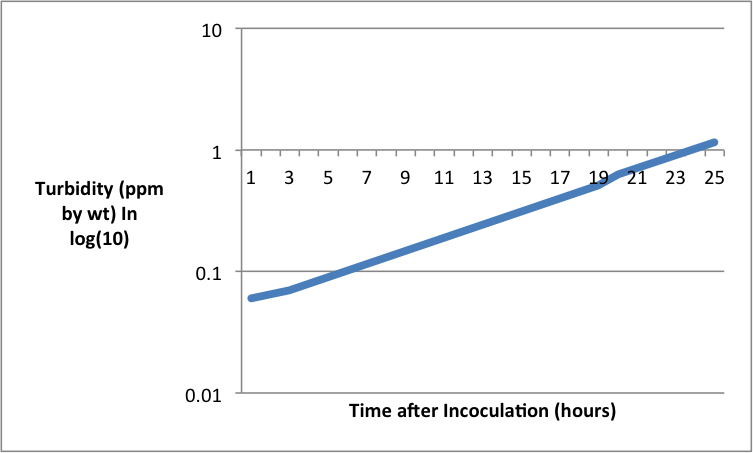 AnalysisFor the purpose of the experiment the turbidity or optical density is representative of colony growth, such as the colony as it grows will let less light through and thus the turbidity goes up. The graph shows an interesting rate of growth within the test sample. We can see a lag phase towards the beginning where there is hardly any growth in the first three hours after inoculation. This is possibly while the bacteria are adjusting to their new environment. There is then a slight increase in rate towards the middle of the log phase where the population increases from 0.07 to 0.54 between hours 3 and 19. At this point the log phase initiates where the gradient and thus the rate of growth increase greatly and the population size increases from 0.54 to 1.16 between hours 19 and 24. This shows an exponential increase in growth phase and curve. These phases are caused by the fact that initially the bacteria are adjusting to their new surroundings and beginning to multiply slowly thus not clouding the medium very much and thus revealing a slow turbidity. Then a significant growth rate increase is hit in the log phase, whereupon the bacteria will begin to use up much of the nutrient available to reproduce which will cloud the mixture giving a higher turbidity. The reason for this is as follows; the variation, with growth rate, of the yield of organism from the substrate used as energy source is attributed to consumption of energy at a constant rate for cell maintenance. From the laws of growth, a simple relation between the maintenance requirement, the growth yield and the growth rate is derived.[1] The exponential growth rate constant is 0.1780, which means the bacteria will take 5 hours to double the population from the beginning. As also shown by the graph. [1] Pirt, S.J., 1965. The maintenance energy of bacteria in growing cultures. Proceedings of the Royal Society of London B: Biological Sciences, 163(991), pp.224-231. EvaluationThe experiment was performed well on a whole however there are tow noteworthy comment to be made. First of all a value was eliminated from the graph due to its anomalous nature as it came into a negative value at the beginning, this could also not be placed on a log scale thus was removed from the experiment. Possibly repeating the experiment in order to gain a broader range of results would help to produce a set of data with no anomalous results. Further to that it would allow an average exponential growth rate for this particular bacteria in these conditions. Secondly the experiment could have been done for longer. The end of the graph shows the beginning of the log phase and doesn’t reach a plateau or death phase. Perhaps increasing the time the experiment is done over to 48 hours would reveal the further phases of the microbial growth. Evidence
1 Comment
ObjectiveTo observe the internal and external insect tracheal system To fix a slide with part of the tracheal system and observe this under the microscope. Apparatus
Saftey
Method
ObservationsThe simplicity and effectiveness of the respiratory system in the locust is what defines its brilliance. It’s clearly ordered into three main structures. The spiracles on the dorsal side of the abdomen and thorax located on the exoskeleton. It is clear that the purpose of this structure is to allow gasses to pass in and out of the body. The second are the tracheae; thin structures that roam across the body of the insect. These are the largest structures in the system at about 1mm in diameter. They carry the air further down the system. Finally there are the tracheoles, which are the smallest structures and got into the muscle fibers themselves. This is where the gas exchange happens. However it is clear to me that their respiratory system is what ultimately limits their size. Due to a lack of an oxygen carrying pigment in their body, their respiratory system to an extent is very inefficient. This is because this system is not efficient enough to supply the body of larger animals with a lower surface are to volume ratio, with enough oxygen to survive. This therefore means that through the process of natural selection, only the smaller insects will survive as they will be the insects with a respiratory system efficient enough for their size and thus will live longer, reproduce more, and pass on their genes more. CPAC 3: Temporary Squash preparation in order to show the different stages of Mitosis under a light microscope Objective To be able to accurately observe cells in the root tip of a garlic plant, and the different stages of mitosis their dividing cells are in. Safety Precautions
Method 1. Fill a small bottle with 1 mol dm−3 hydrochloric acid, and place it in a thermostatically controlled water bath set at 55 °C. Leave the bottle for 15 minutes to let the acid warm to the temperature of the water bath. 2. Place a garlic clove in the top of the bottle so that the roots are submerged in the hydrochloric acid at 55 °C. Leave the roots in the acid for 5 minutes. 3. After 5 minutes, take the clove out and rinse the roots thoroughly in tap water. Use a pair of sharp scissors to cut off several root tips of 5 –10 mm in length. Let them fall into a small vial of acetic orcein standing on a white tile. Use the scissors to make sure that the root tips are immersed in the stain. Place a lid or laboratory stretch film onto the vial. Lids should have a pin- prick hole, or should be slightly loose if they are screw caps, to prevent the ejection of liquid when heating. 4. Place the vial containing root tips in acetic orcein in the 55 °C water bath for 5 minutes to intensify the staining. 5. After 5 minutes, use forceps to take the tips out of the vial, and place them on a microscope slide. Add a drop of water to the root tip on the slide. Tease the root tip apart with needles (maceration), to spread out the cells a little. Cover with a coverslip. Replace the lid on the vial of stain and return it to the teacher as instructed. 6. Wrap the slide in several layers of paper towel and press gently on the paper to squash the tissues. Take care not to twist the slide as you press down or the coverslip will break. 7. Examine under the microscope on low power to identify the area of dividing cells or meristem. Position the cells in the centre of the field of view. 8. Move to high power (×400) in order to identify as many stages of the cell cycle as you can in your field of view. 9. Count the number of cells in each of the stages of mitosis, plus interphase, in the field of view. Record your results in a table. Observations 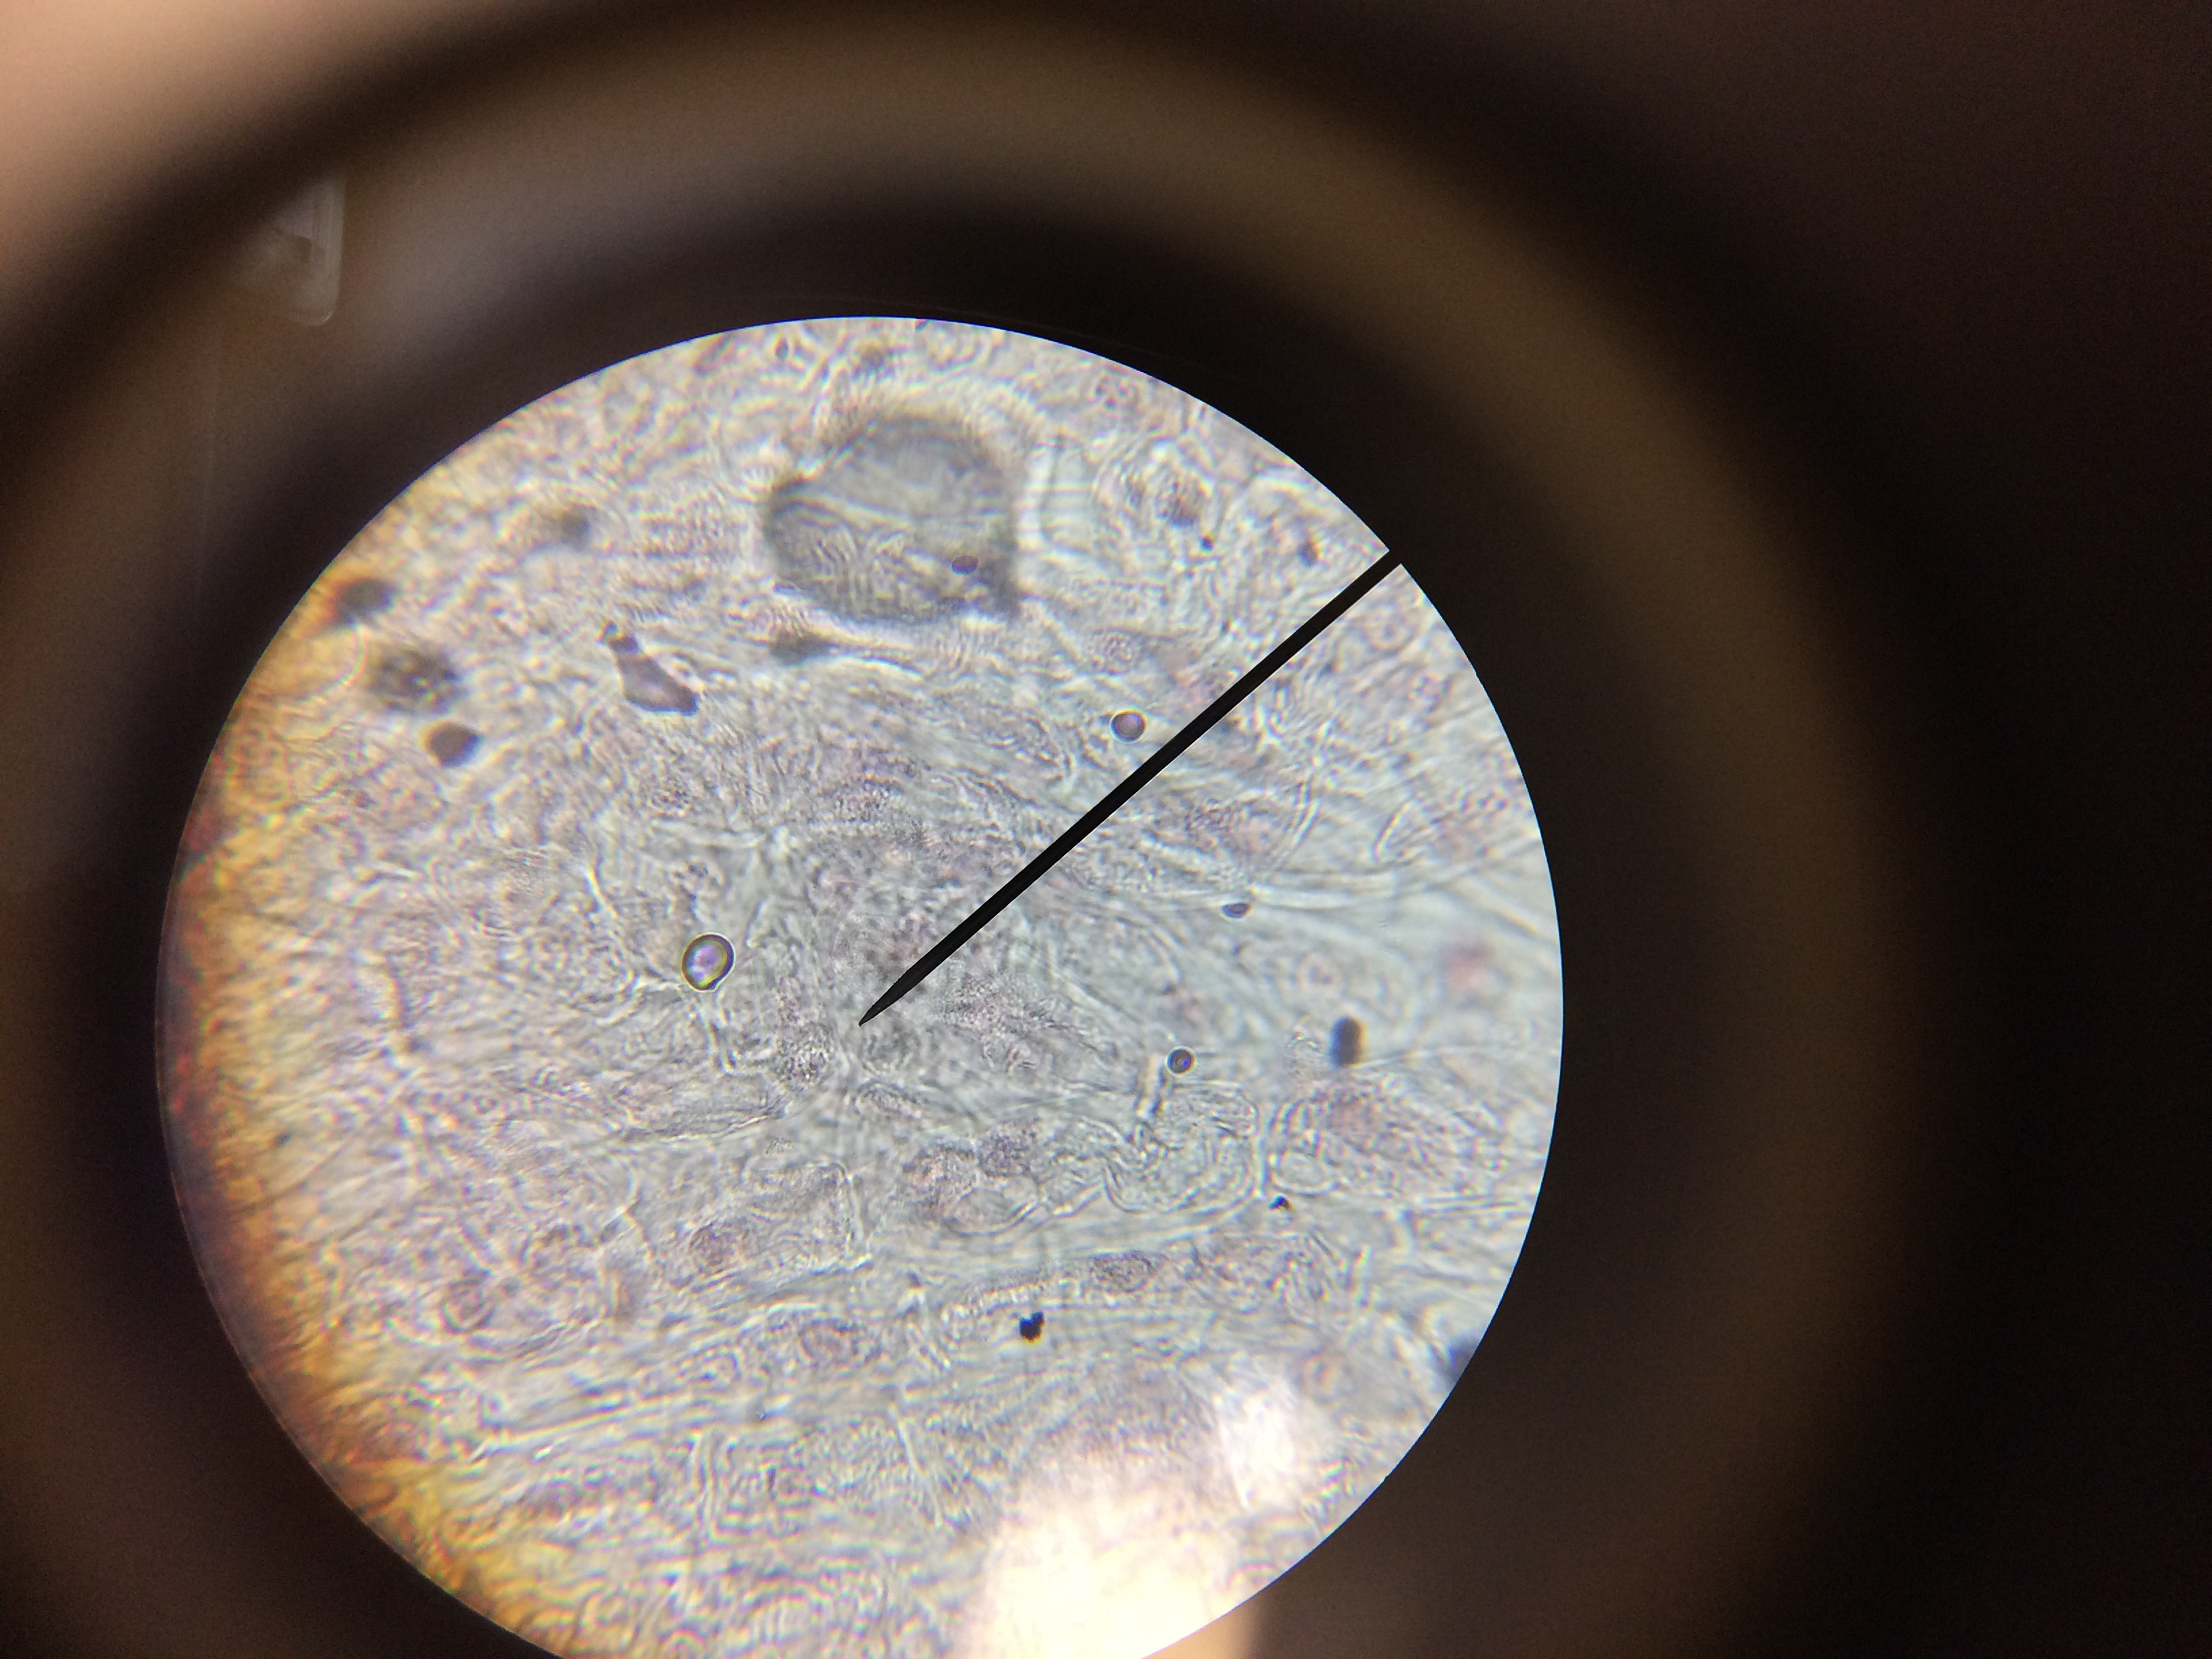 Here we can clearly see these four different examples of points in the process of mitosis. We can see two examples of anaphase and two examples of prophase. We can now use this data to form a mitotic index for this specific cell depicted above. I have used 25 different cells observed for my set basis. I can then utilize this equation: MI=(Number of cells showing signs of mitosis/total cells counted) X 100 MI = (4/25) X 100 = 16.66% HypothesisI predict that the percentage of plasmolysed cells will increase as the concentration of the NaCl is increased. This is because the high concentration of salt in the soloution will cause more water to diffuse out of the cell by osmosis, as the concentration gradient will increase. VariablesDependent; % of cells plasmolysed as a result of the change in solution concentration. Independent; Concentration of the solution in M Control; number of cells used for the percentage, size of the sample of onion, same onion used in every test Apparatus
Method
Results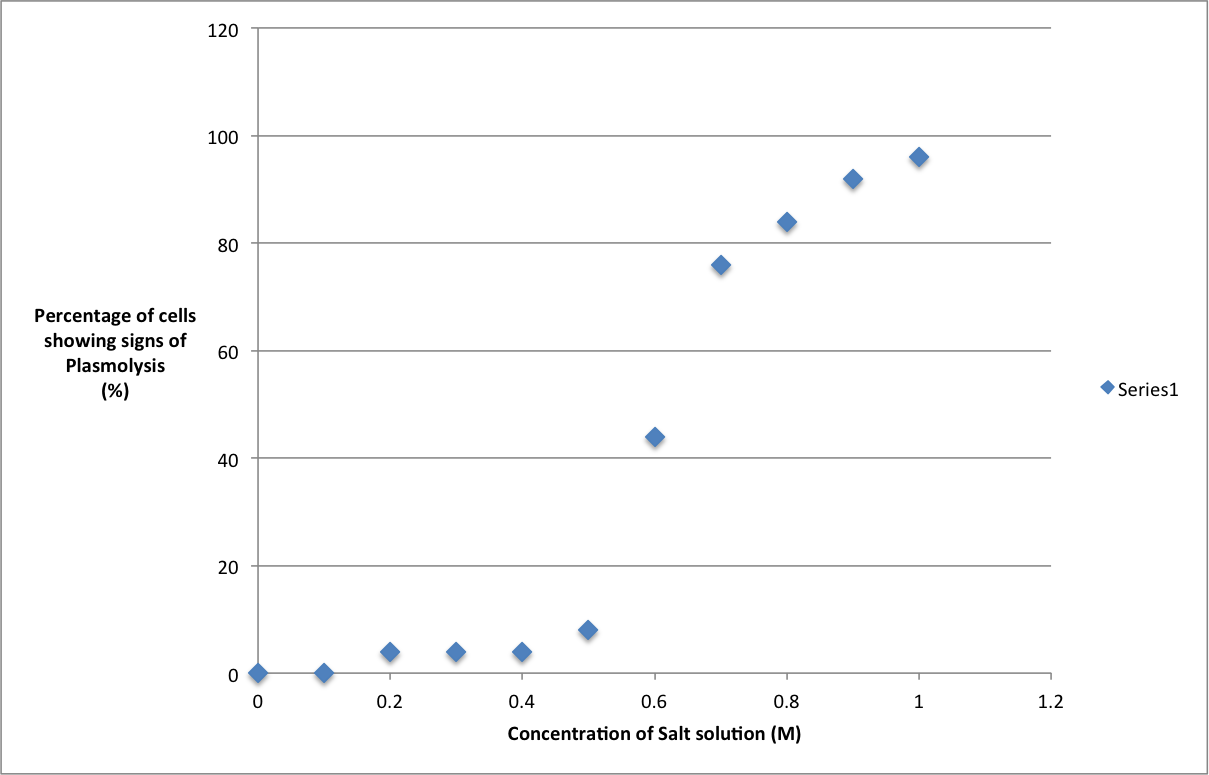 Graph showing percentage of cells plasmolysed against concentration of solution in ConclusionThe results show here that the increase in the concentration of the soloution will indeed cause the % of cells that show plasmolysis to increase as well. This is proven as an increase in the concentration of the surrounding soloution will mean that there is a lower concentration of water molecules outside the cell than in. The concentration gradient will increase as the concentration of water outside the cell decreases and so more water will diffuse out by osmosis and so will cause the cell membranes to retract from the cell wall as the cell now no longer is turgid and has a lower turgor pressure creating more cells that display plasmolysis Its also worthy to note that as the water potential of the surrounding soloution decreases as the concentration increases meaning more water will be drawn out of the cell. When we get to the point where 50% of the cells are plasmolysed we get something called incipient plasmolysis. This is where the concentration of the water both in and out of our cell is the same. For us this point seems to lie just over the 0.6 mol dm-3 so we can deduce that the point of incipient plasmolysis will be at 0.64 mol dm-3 EvalutationThis experiment could have been a lot more reliable when producing our results. Unfortunately we were very much constrained for time so we had no time to do repeats for our experiments so the results are just from one round of trials. However I feel like the accuracy of the equipment was more than adequate for the experiment. The error on the ruler (± 1mm), the timer (± 0.5 ms) and the syringe (± 0.5 ml) are adequate enough to provide very accurate results. I thought that the variable intervals we a bit too large, IO think that they could have been brought down to 0.05 per interval but this would have taken up too much time. However it would have allowed us to see a little bit more clearly where the jump in % plasmolysed starts between 0.5 and 0.6 mol dm-3 Finally I think we could have maybe introduced another control variable in the form of temperature. We could have done this by placing our sample and soloution into test tubes in a set temperature water bath ResearchResearch
Plasmolysis can also have an industrial effect as it helps the in vitro embryogenesis to be more successful An article from PCTOC ( Plant Cell Tissue and Organ Culture ) states: "Adventive embryogenesis in vitro-grown somatic cells of Daucus carota L. was increased three-fold by a 45 min plasmolysis pre-treatment using 1M sucrose solutions. A high degree of synchronous development also resulted from this treatment. The enhancement of embryogenesis is interpreted as an increase in the regeneration of cells which have become physiologically somewhat isolated from the tissue of their origin by the plasmolysis-caused rupture of plasmodesmata."[1] [1] Wetherell, D.F., 1984. Enhanced adventive embryogenesis resulting from plasmolysis of cultured wild carrot cells. Plant cell, tissue and organ culture, 3(3), pp.221-227. HypothesisI predict that when the temperature is increased, the lower the percentage transmission will be. This is because at higher temperatures, the proteins in the phospholipid bi-layer will denature and be broken down and so will allow the pigment kept in the middle of the bi-layer to diffuse out easier, and thus the solution will have a darker colour and so will not let as much light through. Apparatus
Safety Procedure
VariablesIndependent: The temperature of the water bath in which the beetroot was kept in Dependant: The percentage transmission of light Control: pH of the water, length of beetroot cylinder, time spent immersed in the water bath Method
Results ConclusionIn this set of results its clear to see an obvious trend bar one anomaly. The average percentage transmission slowly decreases from 79% to 68% at a steady rate between 1 degree and 39 degrees. Then suddenly after this point the average percentage transmission decreases rapidly from 68% to 25.5 % once the temperature reaches 48 degrees. However we then encounter an anomaly, where the percentage transmission increases slightly when the temperature increases to 60 degrees up to 32%. However the trend then continues again, where yet another increase in the temperature, to 68 degrees, down to 24%. With regards to the anomaly this could be put down to the lack of repeats with this specific temperature as this temperature featured only two repeats. Either this or human error played a part. The trends in the results, ignoring the anomaly, are explainable with scientific backing. This is all caused by the fact the phospholipid bi-layer in the cell membrane has had the proteins holding the individual lipids together become denatured and so allow more pigment to flow through the gaps in the mosaic layer. This then causes the solution the beetroot is in to become darker and thus the percentage transmission then becomes lower. There certainly is a point shown by the results where the proteins go from slightly denatured to almost completely. This is between 39 and 48 degrees and shows a drop from 68% to 25.5%. This is the point at which there is the greatest difference in the average percentage transmission. EvaluationFirstly we can clearly see an anomaly in our results at 48 degrees which unfortunately makes the results a little less reliable despite the repeats. We repeated the experiment at each temperature at least twice but in hindsight we should have done this at least one more time. I do however think that the results are still accurate as the equipment used were all set to fine units of measurement. The colorimeter was especially accurate as it removed the chance for human error. The conclusion drawn from this is valid as not only do the results support them but the science does as well Overall I find the experiment to be well executed. ResearchIt is also that other environmental effects can affect membrane permeability. This can include reduced water content inside the plant cells. This then affects the plants ability to form a phospholipid bilayer and then allows the cell to “leak”. It essentially begins to allow soluble molecules to leak out in this state.
An article from New Phytologist says; “Current views on membrane construction are presented as a basis for discussing certain modifications of structure that may render membranes leaky, allowing solutes to diffuse from them. Biophysical experiments on dehydrated membranes indicate that, when their water content is reduced below 20%, they no longer adopt the lipid bilayer conformation. When dry seeds, spores or lichens are placed in water, soluble cell constituents leak from them for a few seconds or minutes until membrane integrity is re-established; the same may apply also to the liberation of solutes from pollen grains. Moreover, there are indications that ‘dry’ in this context means having less than about 20% water.”[1] [1] Simon, E., 1974. Phospholipids and plant membrane permeability. New Phytologist, 73(3), pp.377-420. HypothesisI predict that with an increase in enzyme concentration there will be a decrease in the time taken to create the curd. This is because there will be a higher number of enzymes in a given volume that can collide with the substrate molecules and produce the curd. Hence it will take less time to produce the curd. Apparatus
VariablesDependent: The time taken to produce the curd Independent: the concentration of the enzyme Chymosin Control: Substrate concentration, pH of the solution, pH of the solution, temperature of solution, volume of enzyme solution added Method
Results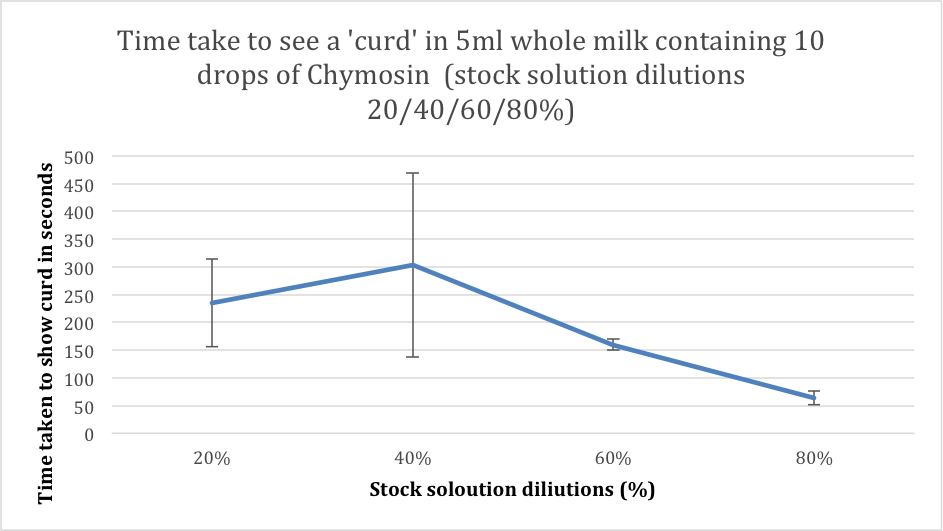  ConclusionThe time taken to produce curd initially increases between the 20% and 40%, from 235s to 303s on average, however if you look at the table of results we can clearly see this is due to the first result being anomalies in the trend. From then on we can see that the time taken to produce the curd rapidly decreases as the percentage concentration increases. This is shown as between the 40% and 80% the average time taken to produce curd decreases from 303s to 64s. This shows that when the percentage concentration of the enzyme is increased, then the time taken decreases, and hence the rate of reaction increases (we now this as the rate of reaction is the reciprocal of the gradient). And also we can see that the change in percentages according to our graph are likely to significantly affect each other as the error bars ( apart form the anomaly ) don’t overlap. EvaluationThe reliability of these results can be called into question due to the fact that we have and anomaly in our results, which is the first one however the rest of the graph follows a trend which we would likely see in any other experiment meaning that we can only rely on these results to a certain extent I do however say that for the most part the numbers should be very accurate, the number of repeats we had per percentage was 5 that should have been plenty to produce the expected results. However in the case of our first result at 20% we can safely say the anomaly is caused by human error. The one major problem I see with the experiment is the independent variable interval size is far large small. We should have used intervals that were around 10% intervals so we can see a clearer trend in the results. A further experiment could be to see the effect of an increase of competitive inhibitors on the rate of reaction of the Chymosin. We could do this by varying the concentrations of the inhibitors by 10% each time and using a competitive inhibitor to Chymosin, which is known as CP-113972. ObjectiveTo be able to observe the cross section of the Rat Kidney cells under a light microscope and identify where the loops of henle are. Method. First set up the microscope carefully, being sure never to touch the objective lenses . Then place the slide containing the sample onto the stage, clipping it into place . Adjust the dials to bring the slide as close as possible to the objective lens without making contact. . Put your eye up to the eye piece and slowly adjust the dial, brining the stage lower, until you can clearly see the sample . After doing this attempt to locate the part of the image that is the loops of henle ObservationsThe slightly smaller circles in the image were positively confirmed to be the loops of henle. The numerous quantity of them reflects the human need for osmoregulation during homeostasis. 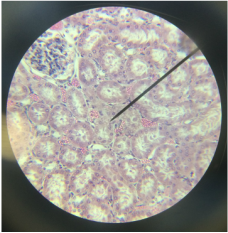 Image of the cells viewed from a light microscope
|
 RSS Feed
